电器与能效管理技术 ›› 2020, Vol. 592 ›› Issue (7): 81-86.doi: 10.16628/j.cnki.2095-8188.2020.07.014

• 工业互联网技术 • 上一篇    下一篇

基于边缘计算网关的企业用电行为可视化分析

沈颖1, 李昌2   

  1. 1.上海市软件行业协会, 上海 200125;
    2.上海申瑞继保电气有限公司, 上海 200233
  • 收稿日期:2020-03-29 出版日期:2020-07-30 发布日期:2020-08-10
  • 作者简介:沈 颖(1982—),女,工程师,主要从事软件工程、大数据分析研究。|李 昌(1974—),男,教授级高级工程师,主要从事电力系统分析及能源管理研究。

Visualized Analysis of Enterprise Power Consumption Behavior Based on Edge Computing Gateway

SHEN Ying1, LI Chang2   

  1. 1. Shanghai Software Industry Association, Shanghai 200125, China;
    2. Shanghai Sunrise Relay Electric Co.,Ltd., Shanghai 200233, China
  • Received:2020-03-29 Online:2020-07-30 Published:2020-08-10

摘要:

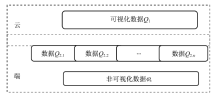
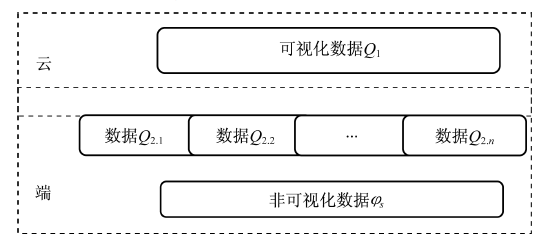
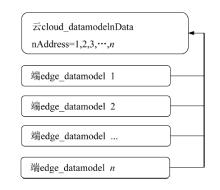
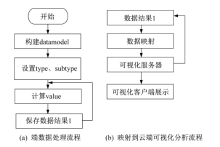
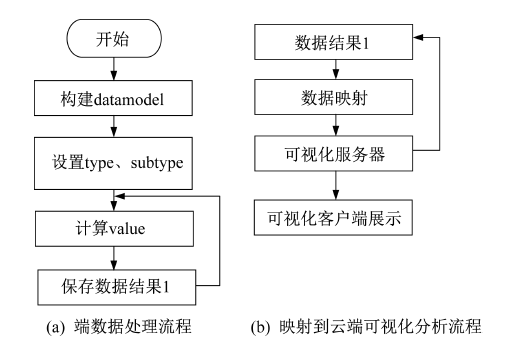
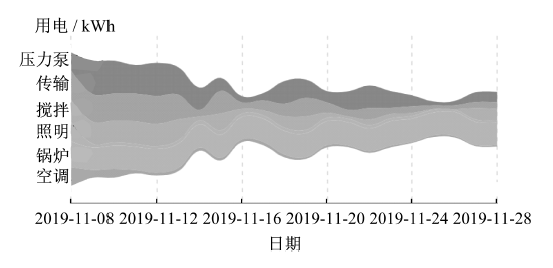
采用边缘计算网关对企业用电行为进行可视化分析。针对物联网大数据可视化实时性要求,提出核心可视化数据结构模型,建立企业端和数据云两者数据结构映射,分离数据处理和可视化业务,给出云和端的企业用电行为数据模型,最后基于echart的可视化完成企业用电行为分析。算例采用某制造行业用户端电力负荷数据,给出可视化分析的部门业务,采用边缘计算对企业用电行为数据进行分析计算,通过物联网实现数据交互,在云端实现可视化互动。算例结果表明所提方法在可视化响应速度提升和业务扩展性方面具有一定实用性。

关键词: 边缘计算, 企业用电, 数据网关, 可视化

Abstract:

Edge computing gateway is used to visualize the behavior of the company’s electricity consumption.To meet the real-time requirements of IoT big data visualization,the core visualization data structure model is proposed,the data structure mapping between enterprise and data cloud is established,the data processing and visualization services are separated,the data model of enterprise power consumption behavior is given to the cloud and the enterprise power consumption behavior model,and finally the analysis of enterprise power consumption behavior is completed based on echart.The algorithm uses a manufacturing industry’s user-side power load data to give a visual analysis of the department’s business,and uses edge computing to analyze and calculate the enterprise’s power consumption behavior data,and realizes data interaction through the Internet of Things and visual interaction in the cloud.The results of the algorithm show that the method has some utility in visualizing the response speed improvement and business scalability.

Key words: edge computing, enterprise electricity, data gateway, visualization

中图分类号: